Authors:
(1) Jonathan H. Rystrøm.
Table of Links
4 Results
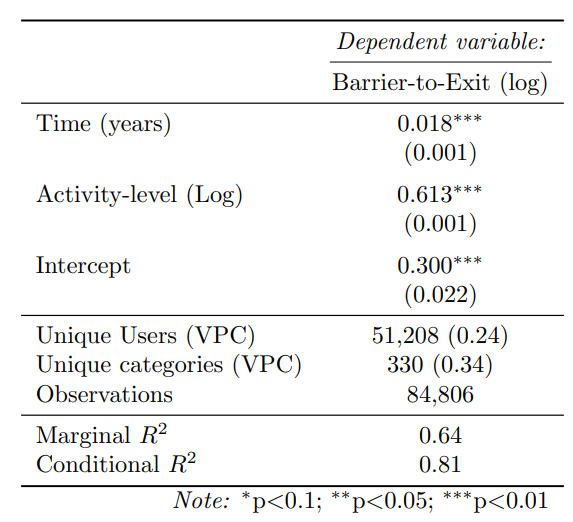
The results from the model can be seen in table 1. The coefficient for time is 0.018 (SE=0.001). This implies growth in Barrier-to-Exit of 1.8% per year. This is highly significant (T=29.95, p ≪ 0.0001). The coefficient for activity level is 0.614 (SE=0.001), which is also highly significant (T=450.11, p ≪ 0.0001).

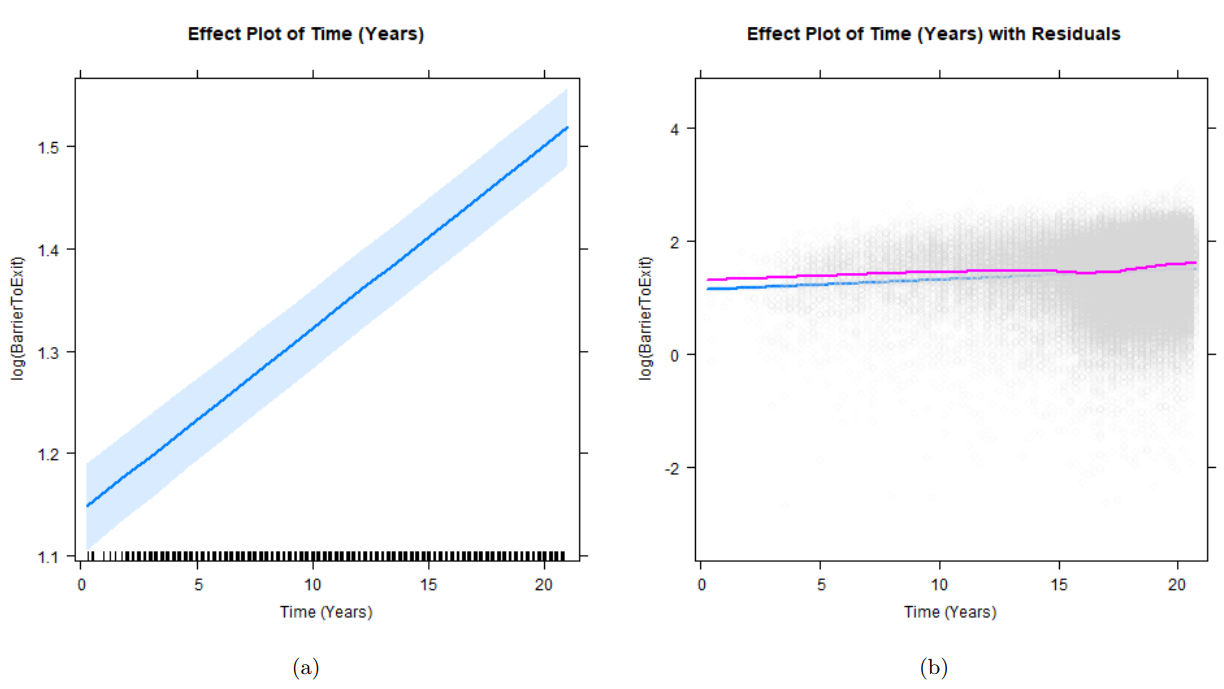
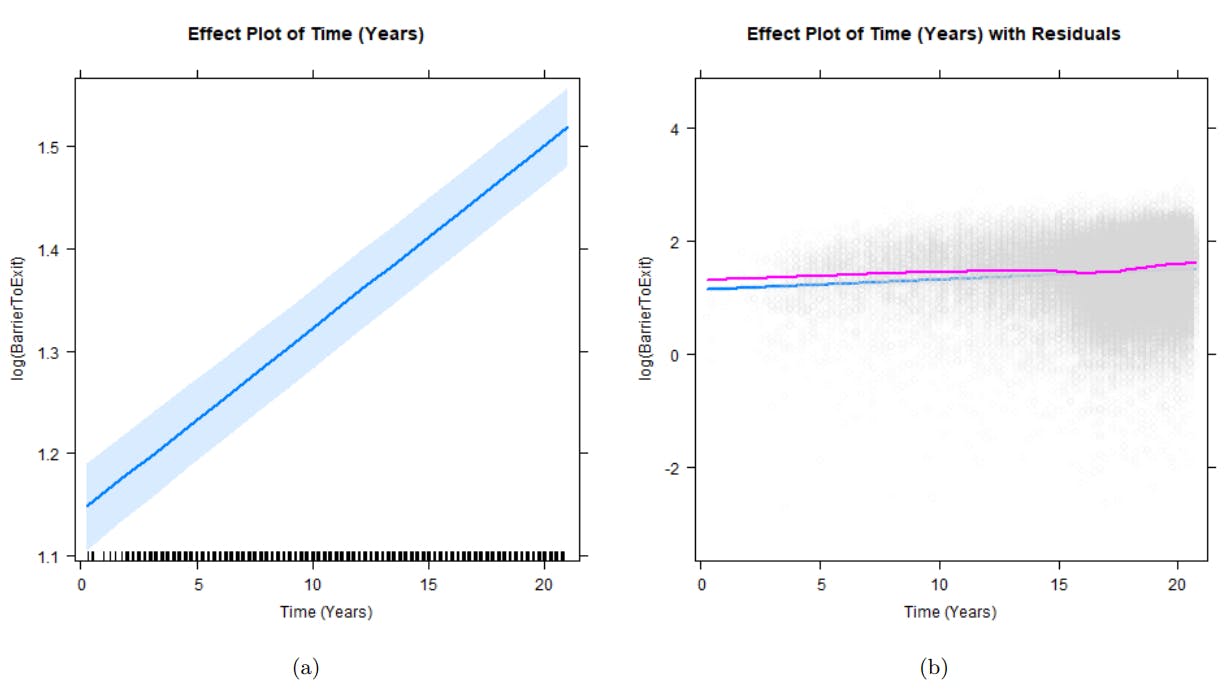
A visual representation of these models can be seen in figure 4. The partial effects plot (Fox, 2003) in fig 4a shows an increase in Barrier-to-Exit from approximately 1.15 to 1.5. This translates into a growth of approximately 43% over the duration of the study. Fig. 4b shows the effect plot with residuals.
This paper is available on arxiv under CC 4.0 license.